Release date: January 2024
This monthly industry data is provided by MHEDA member Rouse Services.
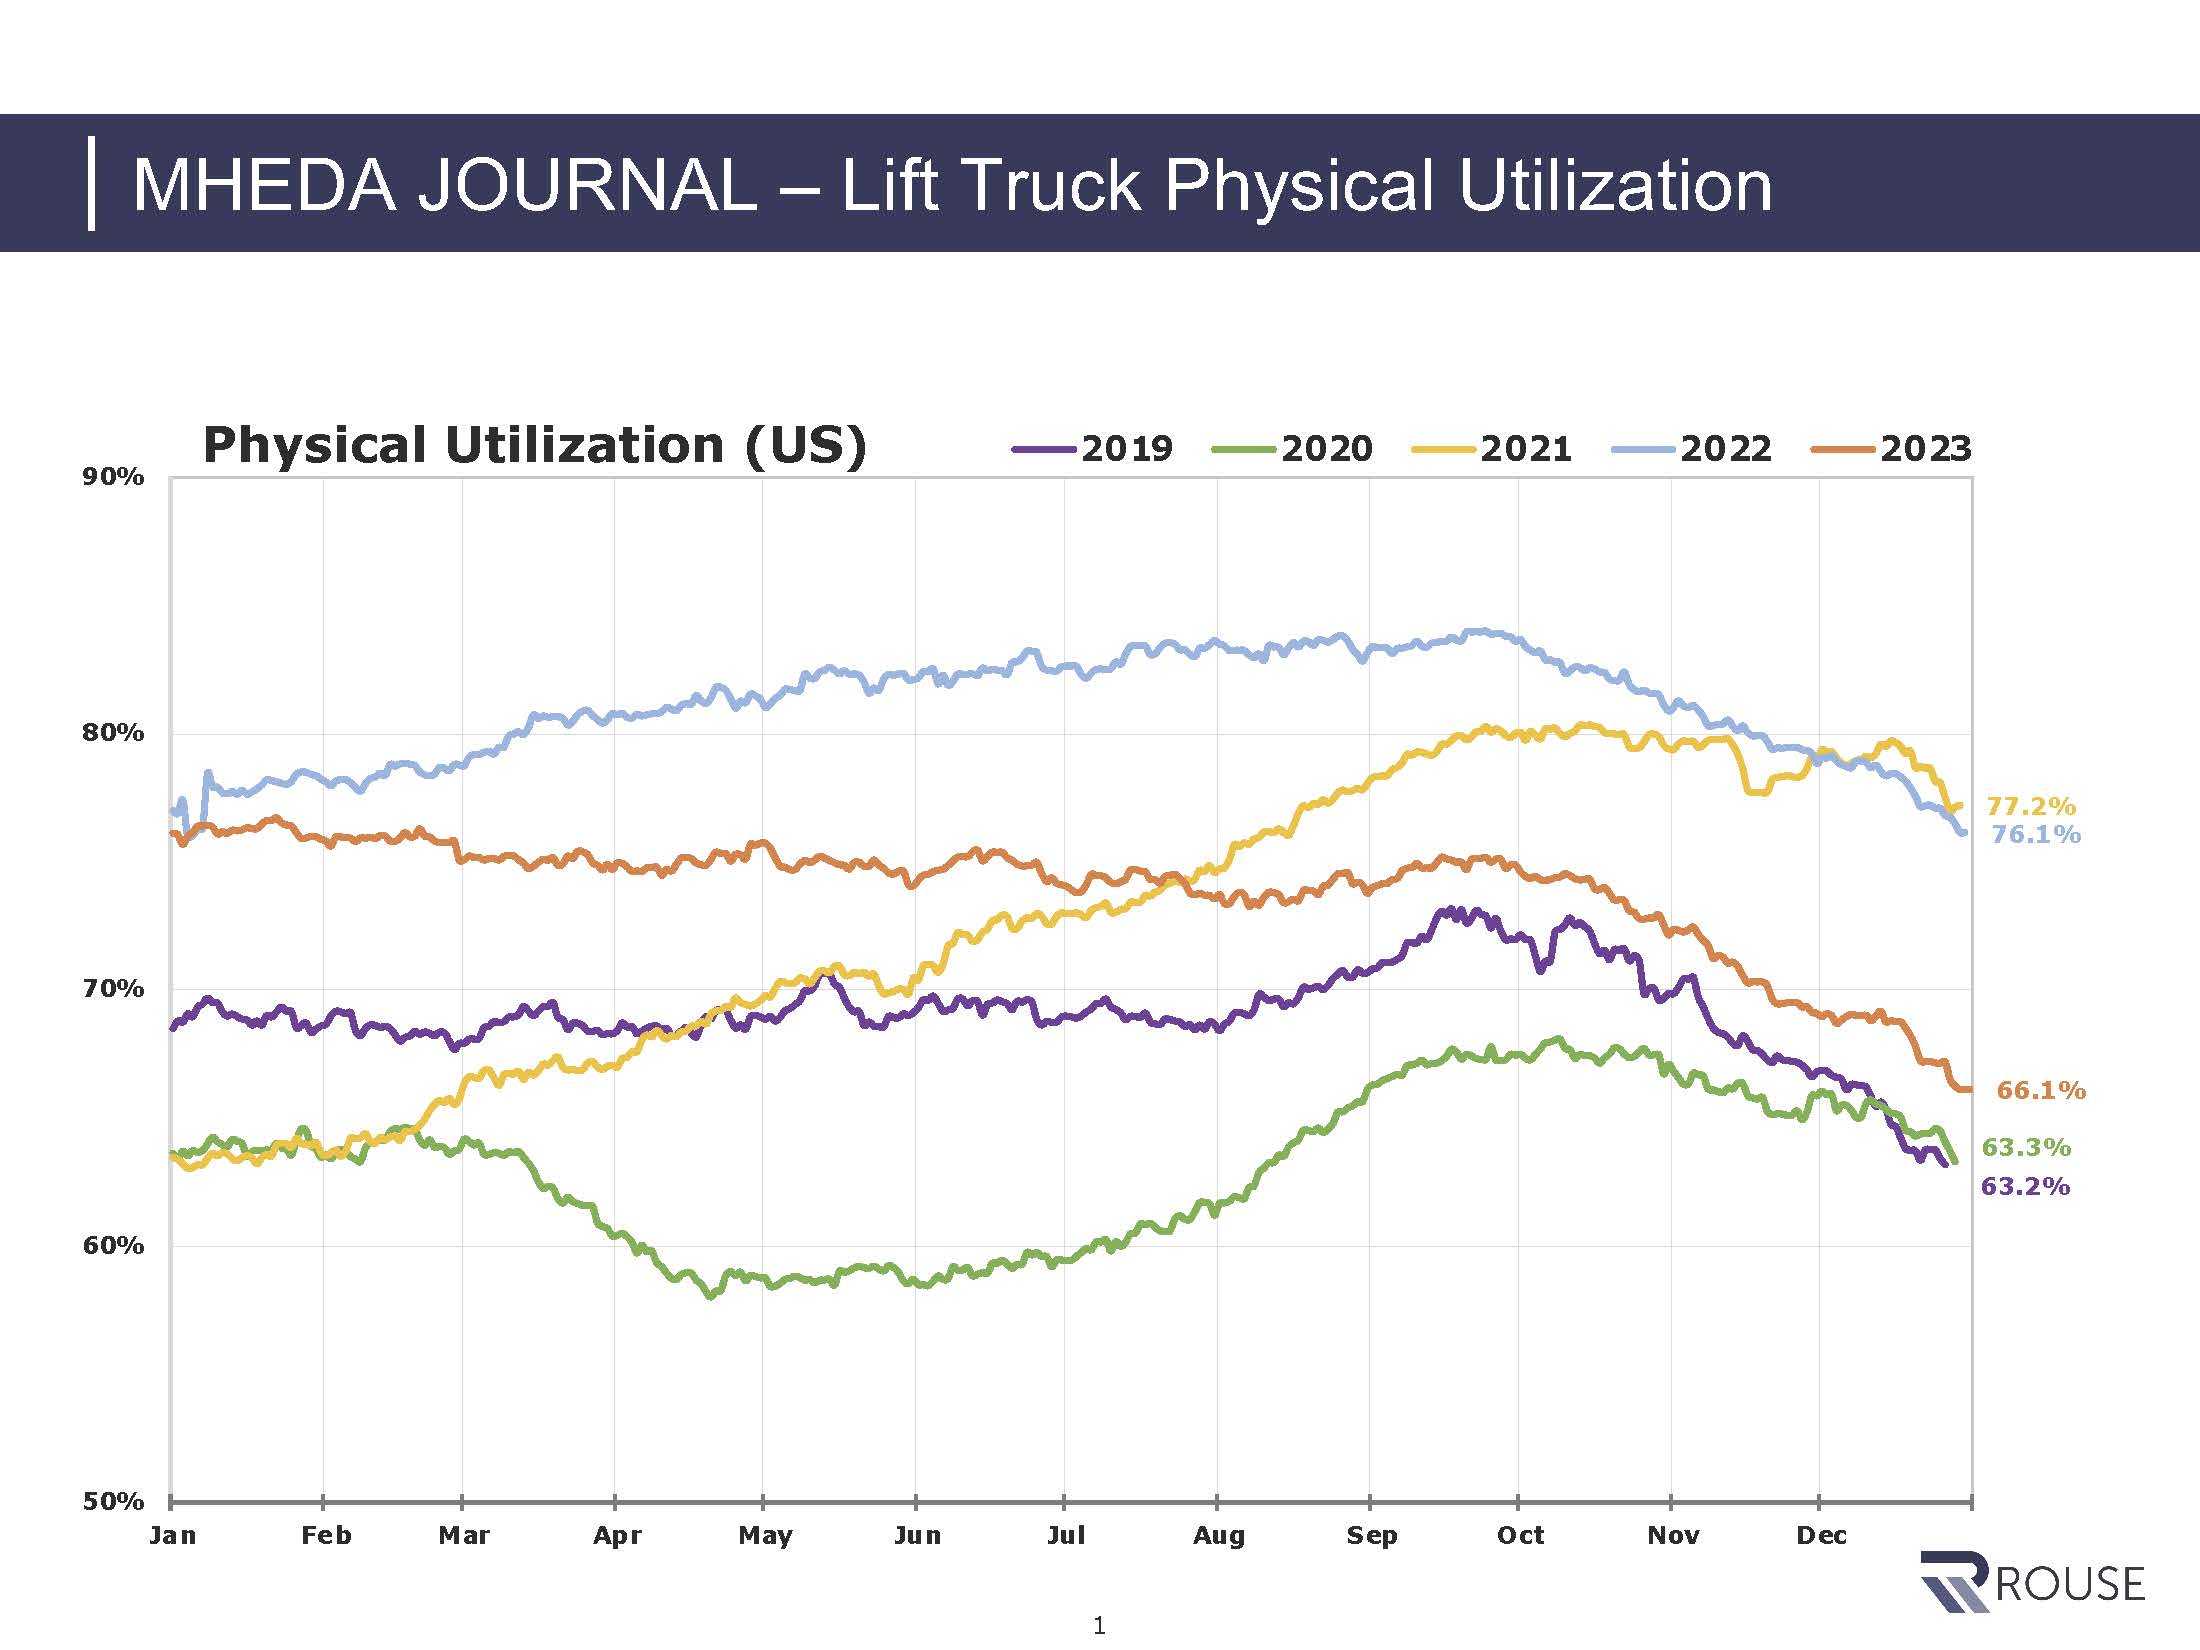
Physical Utilization for Lift Trucks in 2023 concluded the year at 66.1%, positioned between the utilization rates observed in 2019 and 2020 in the low 60s, and the higher utilization rates noted in 2021 and 2022, which reached the upper 70s in December.
Note: Independents and Dealers, USA only. Physical Utilization is calculated based on daily fleet snapshots of Rouse participants’ fleets and is “Average Daily Cost on Rent” divided by “Average Daily Cost in Fleet”
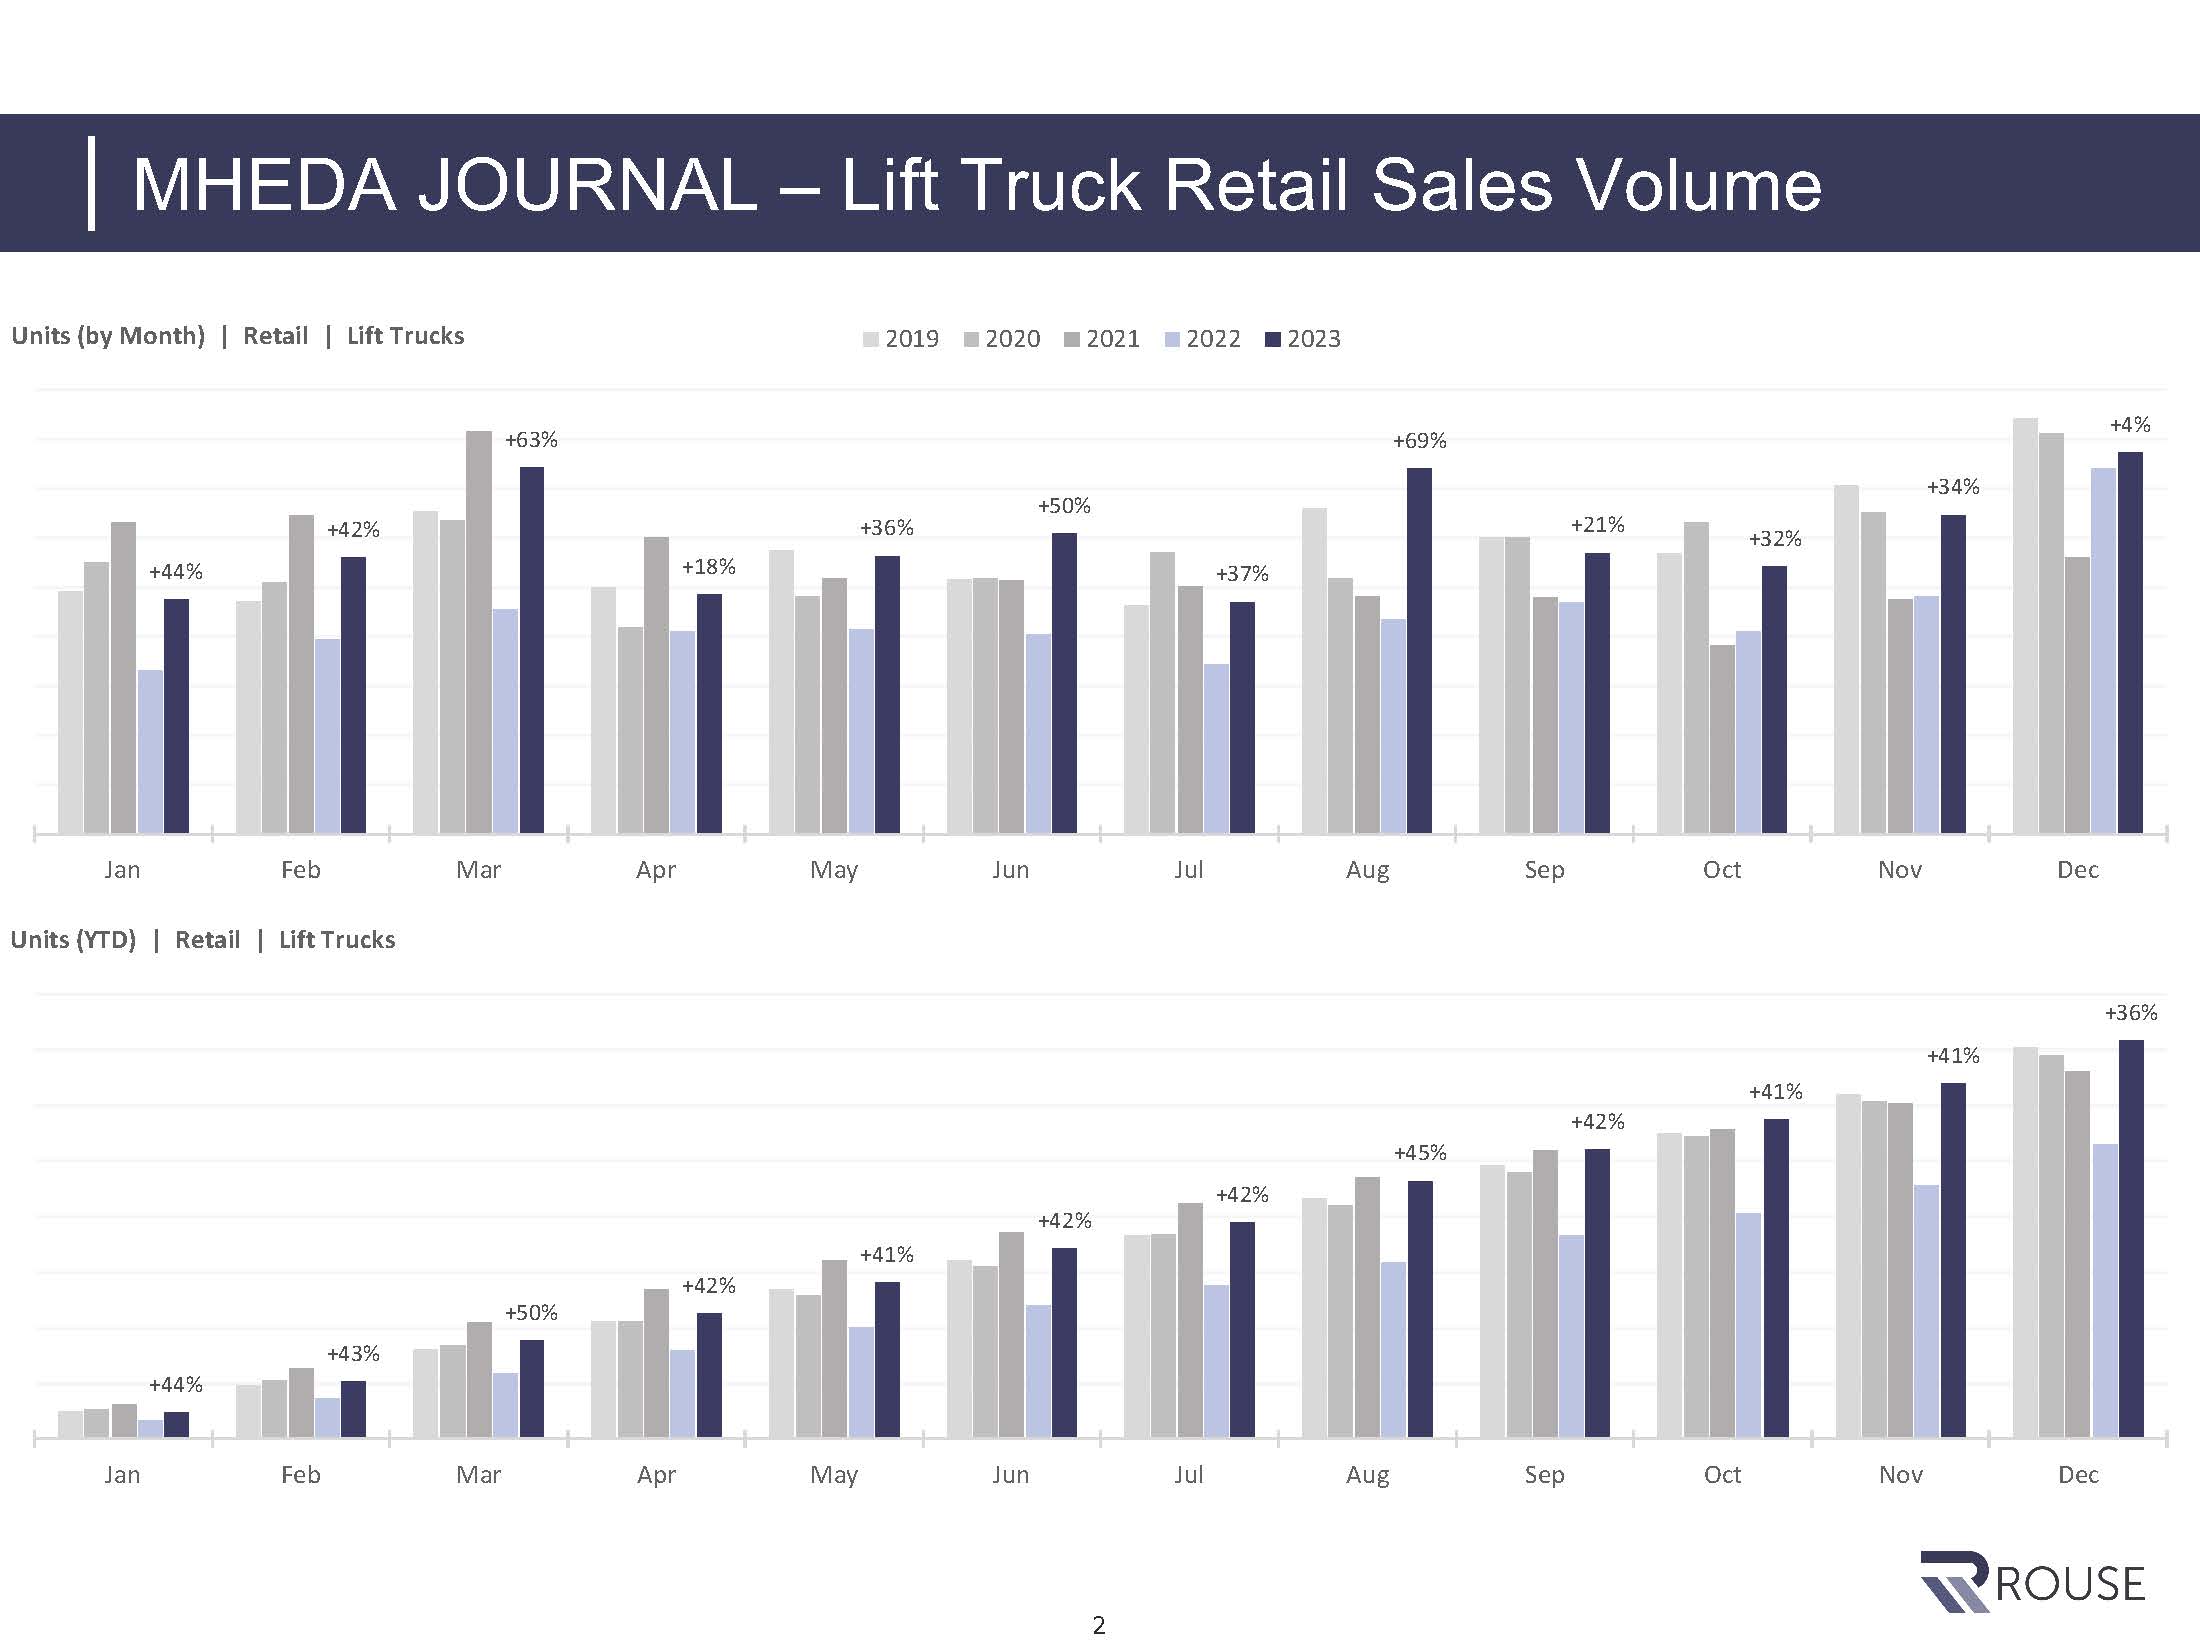
In 2023, retail sales volumes have outpaced figures from 2019 to 2022 and demonstrating a 36% increase compared to the previous year (2022). The majority of this upswing occurred in the early part of 2023, with December sales slightly trailing behind 2019 and 2020, yet still registering a 4% improvement over 2022.
Note: Independents and Dealers, USA only.
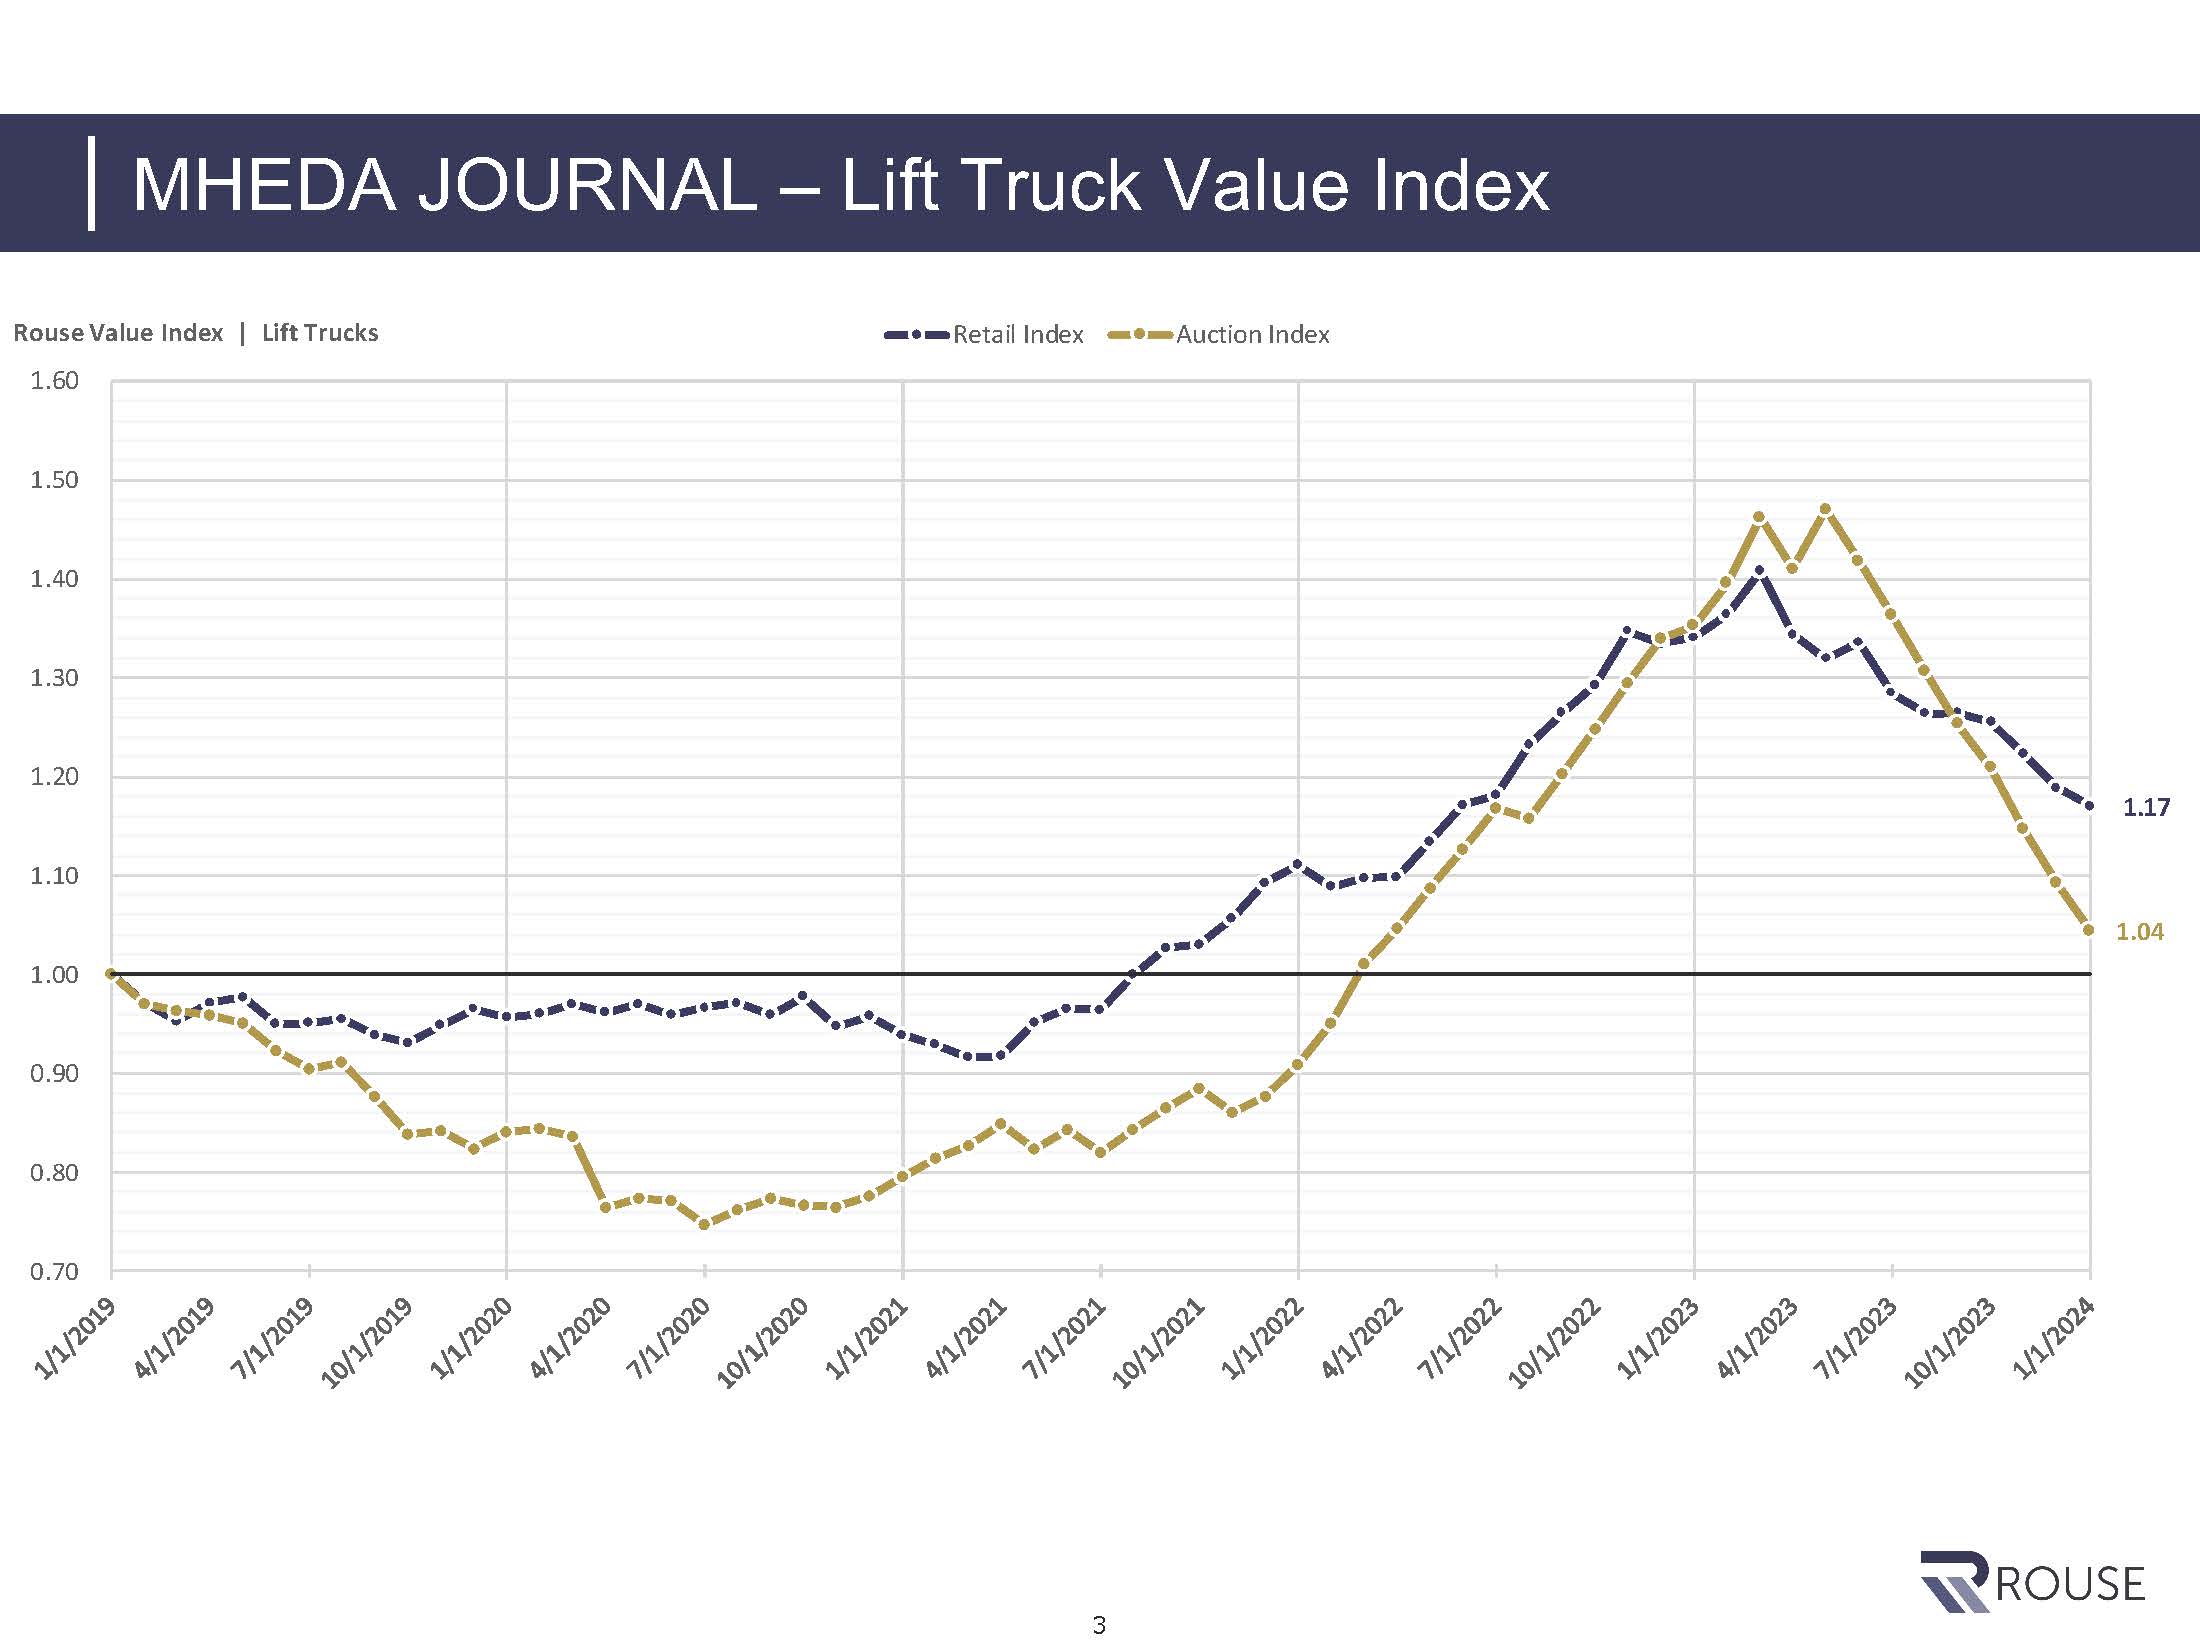
Retail and auction values have maintained a trend of softness, experiencing month-over-month declines since reaching peak values in Q2 of 2023. In comparison to January 2019, retail values have seen a notable increase of 17%, while auction values have also risen, albeit more modestly, with a 4% uptick.
Note: Used Equipment (three to eight years old), Retail and Auction Values Indexed to January 2019, USA only.