Release date: February 2024
This monthly industry data is provided by MHEDA member Rouse Services.
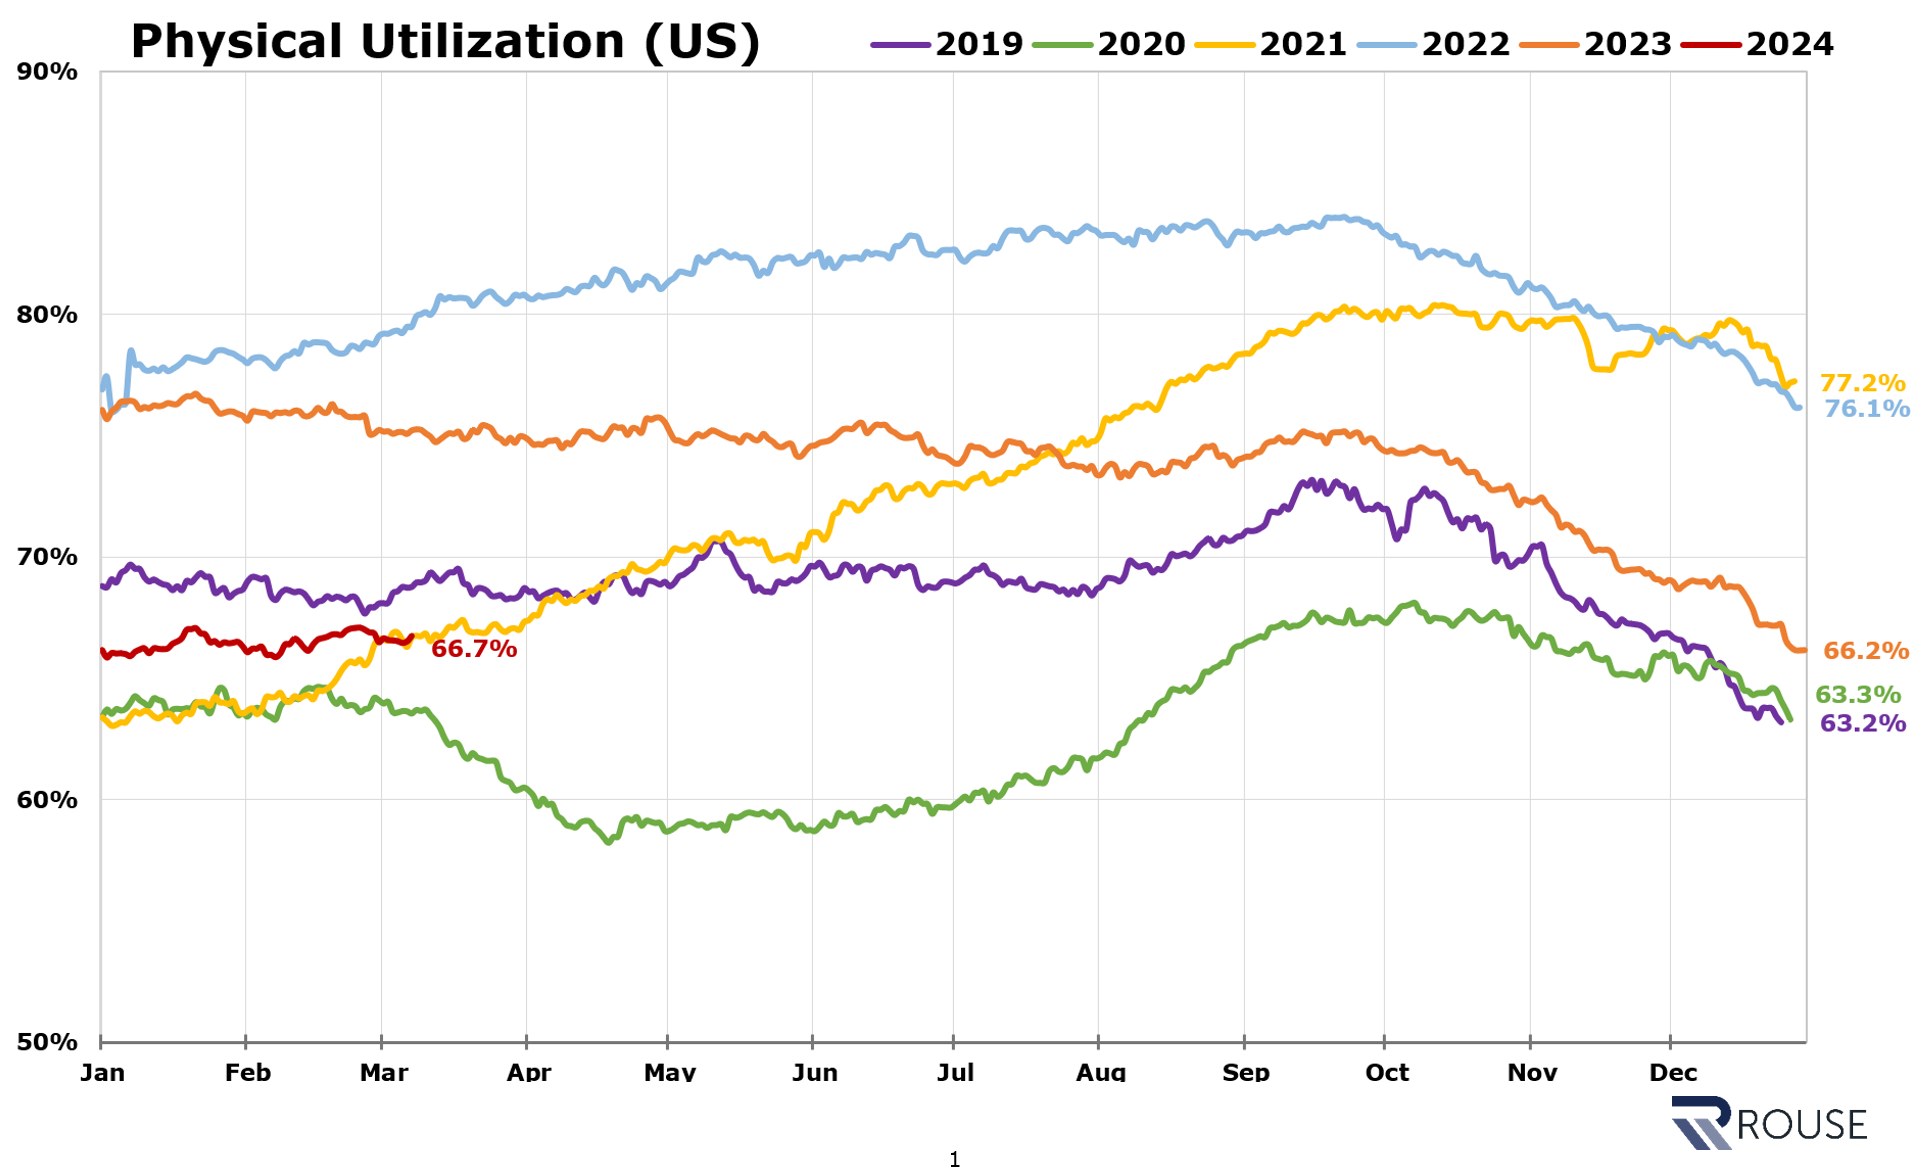
In early March 2024, physical utilization stands at 66.7%. While comparable to 2021 figures, current utilization levels observed fall below those of 2019, 2022, and 2023. This shift primarily stems from increased supply or additional units in fleet, with slowing demand trends playing a relatively minor role.
Note: Limited to independents and dealers in the USA. Physical Utilization is computed from daily fleet snapshots of Rouse participants’ fleets, calculated as “Average Daily Cost on Rent” divided by “Average Daily Cost in Fleet.”
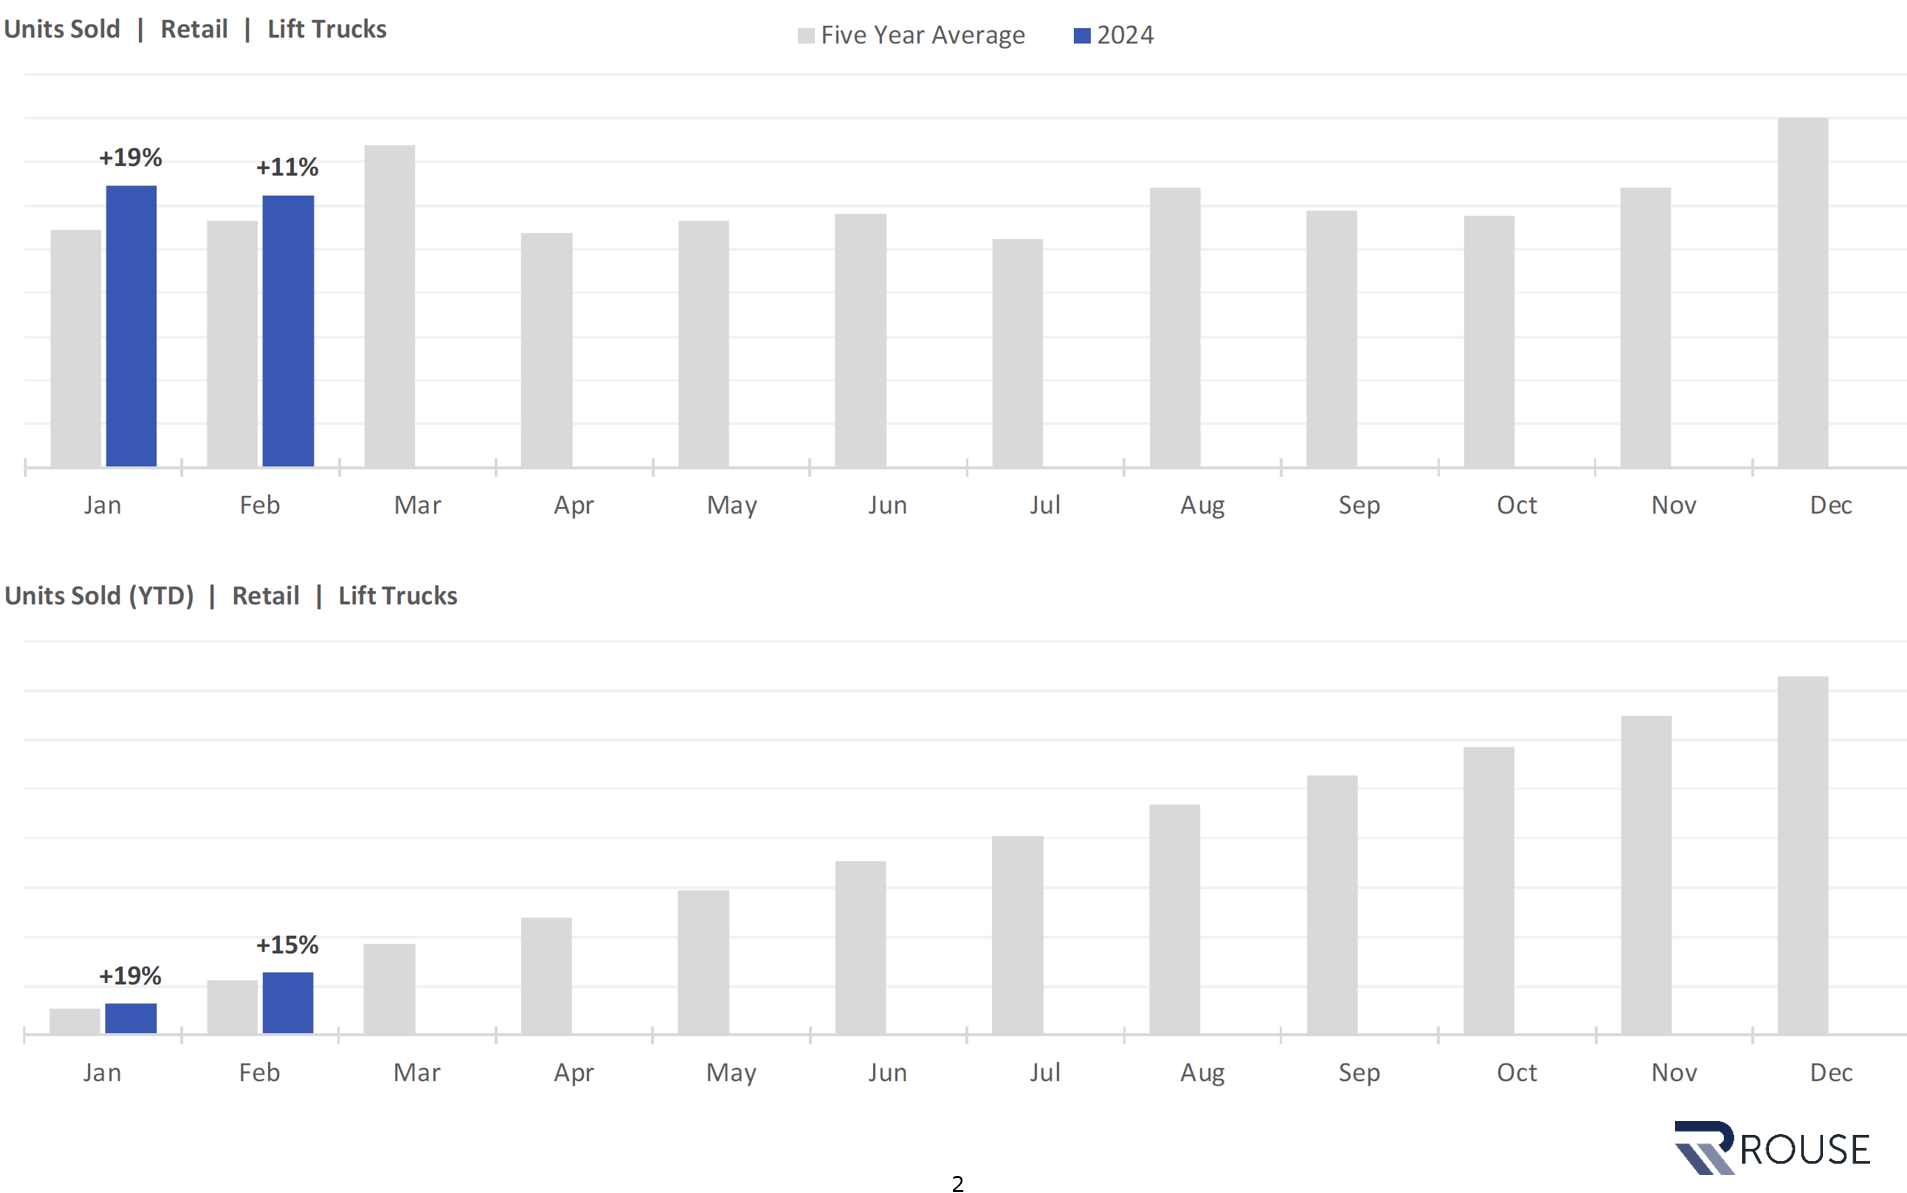
In 2024, retail sales volumes for Lift Trucks have shown increases relative to trailing five-year averages. January witnessed noticeably higher volumes than historical averages, while Year-to-Date volumes in February are 15% higher than the five-year average. Increased volumes can be largely attributed to ongoing improvements in supply chain efficiency.
Note: Limited to independents and dealers in the USA. Used Equipment.
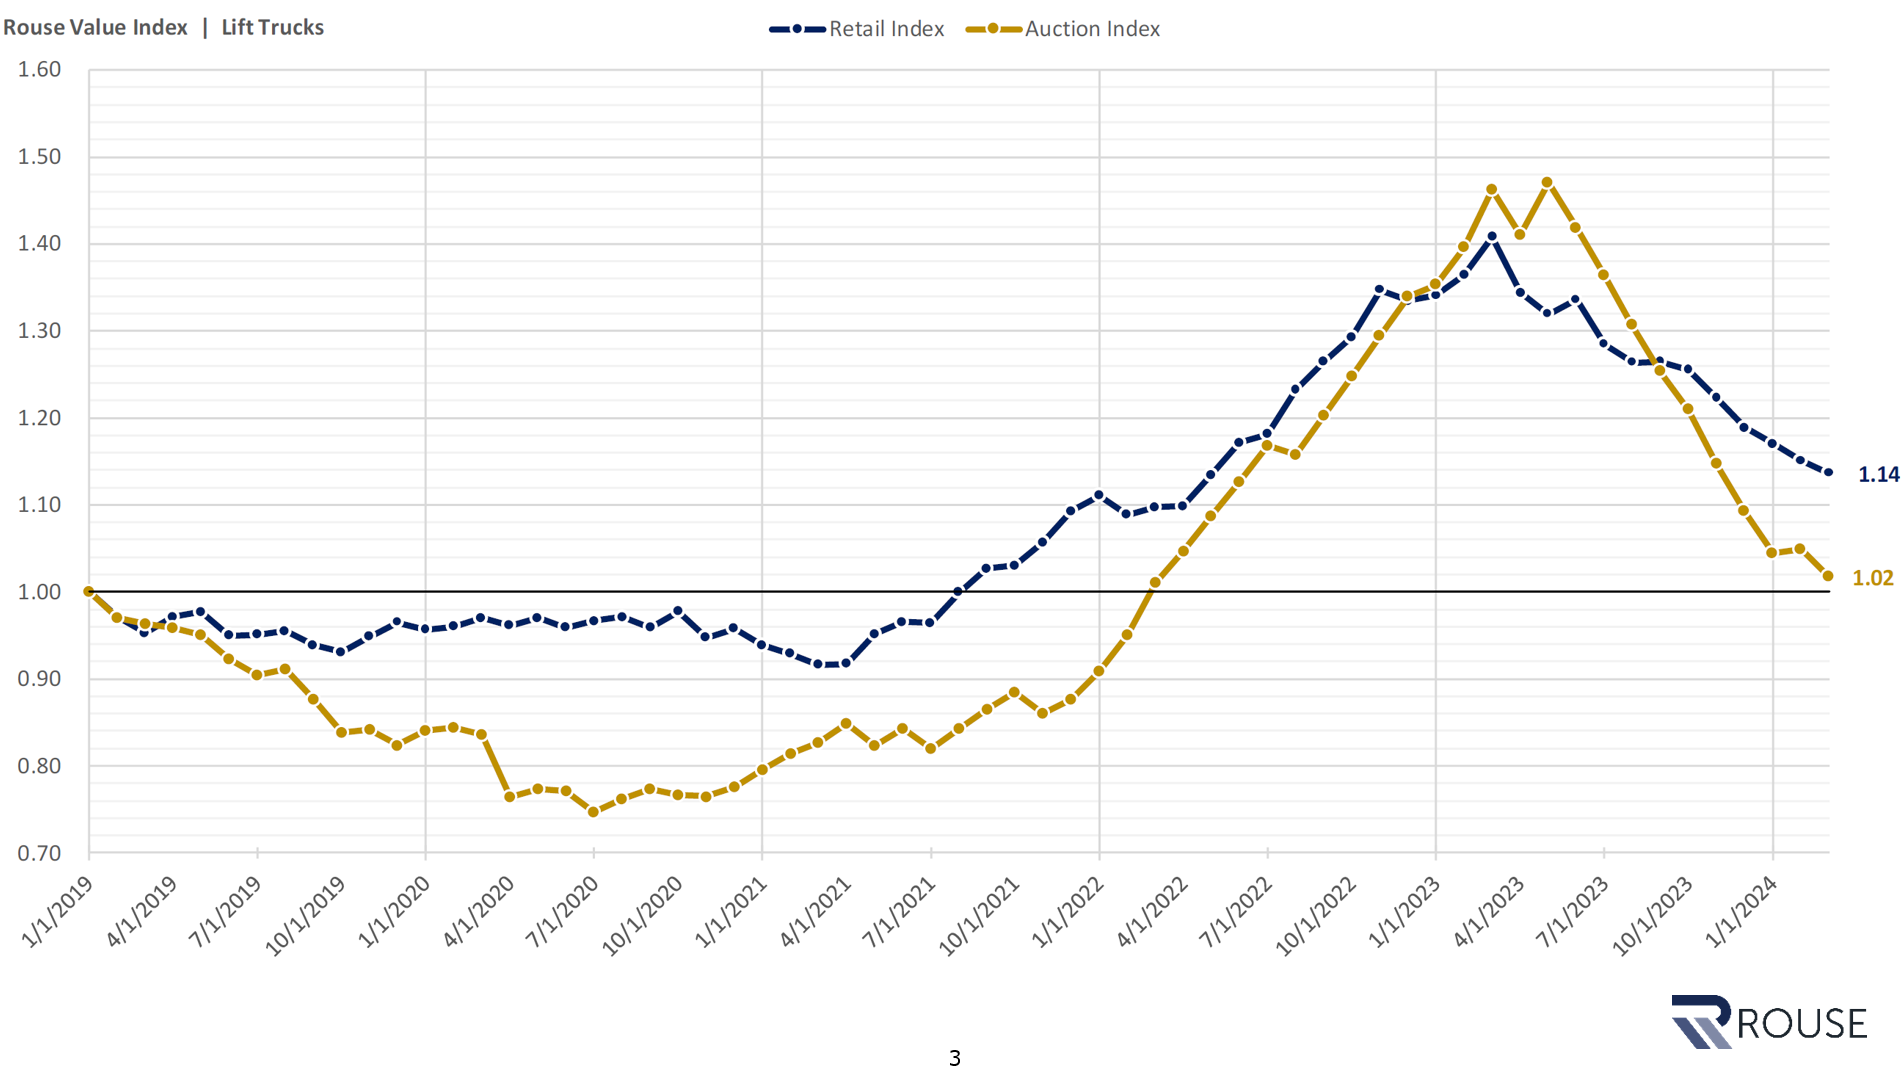
Retail and auction values have sustained month-over-month declines. Retail values are currently 14% higher compared to January 2019, aligning with recoveries observed in May 2022. Auction values, however, have experienced sharper downward pressure and remain 2% higher than the values recorded in January 2019.
Note: Focus on Used Equipment (three to eight years old). Retail and Auction Values Indexed to January 2019, USA only.